- 註冊時間
- 2009-2-11
- 最後登錄
- 2025-11-18
- 在線時間
- 4421 小時
- 閱讀權限
- 90
- 積分
- 64938
- 帖子
- 6875
- 精華
- 0
- UID
- 6270
  
|
本文章最後由 黑面 於 2010-4-17 07:03 編輯
無夏之年(英語:Year Without a Summer)指1816年,因為受1815 年印尼坦博拉火山爆發的影響,北半球天氣出現的嚴重反常。歐洲、北美洲及亞洲都出現災情,夏天出現罕見低溫;歐洲及美洲農業生產受影響尤甚;亞洲氣候亦受影響,中國雲南因而出現饑荒。
請參考 wiki的無夏之年 -- http://zh.wikipedia.org/zh-tw/%E ... 4%E5%B9%B4%E4%BB%BD

檔案描述
Expansion of the Instrumental Record
2nd millennium
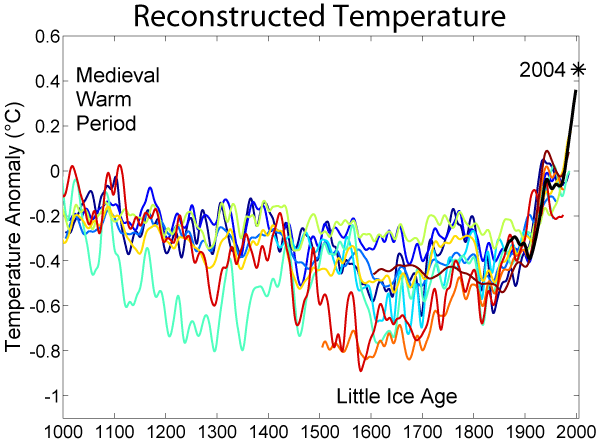
This image is a comparison of 10 different published reconstructions of mean temperature changes during the 2nd millennium. More recent reconstructions are plotted towards the front and in redder colors, older reconstructions appear towards the back and in bluer colors. An instrumental history of temperature is also shown in black. The medieval warm period and little ice age are labeled at roughly the times when they are historically believed to occur, though it is still disputed whether these were truly global or only regional events. The single, unsmoothed annual value for 2004 is also shown for comparison. (Image:Instrumental Temperature Record.png shows how 2004 relates to other recent years).
It is unknown which, if any, of these reconstructions is an accurate representation of climate history; however, these curves are a fair representation of the range of results appearing in the published scientific literature. Hence, it is likely that such reconstructions, accurate or not, will play a significant role in the ongoing discussions of global climate change and global warming.
For each reconstruction, the raw data has been decadally smoothed with a σ = 5 yr Gaussian weighted moving average. Also, each reconstruction was adjusted so that its mean matched the mean of the instrumental record during the period of overlap. The variance (i.e. the scale of fluctuations) was not adjusted (except in one case noted below).
Except as noted below, all original data for this comparison comes from [1] and links therein. It should also be noted that many reconstructions of past climate report substantial error bars, which are not represented on this figure.
The reconstructions used, in order from oldest to most recent publication are:
1. (dark blue 1000-1991): P.D. Jones, K.R. Briffa, T.P. Barnett, and S.F.B. Tett (1998). , The Holocene, 8: 455-471.
2. (blue 1000-1980): M.E. Mann, R.S. Bradley, and M.K. Hughes (1999). , Geophysical Research Letters, 26(6): 759-762.
3. (light blue 1000-1965): Crowley and Lowery (2000). , Ambio, 29: 51-54. Modified as published in Crowley (2000). , Science, 289: 270-277.
4. (lightest blue 1402-1960): K.R. Briffa, T.J. Osborn, F.H. Schweingruber, I.C. Harris, P.D. Jones, S.G. Shiyatov, S.G. and E.A. Vaganov (2001). , J. Geophys. Res., 106: 2929-2941.
5. (light green 831-1992): J. Esper, E.R. Cook, and F.H. Schweingruber (2002). , Science, 295(5563): 2250-2253.
6. (yellow 200-1980): M.E. Mann and P.D. Jones (2003). , Geophysical Research Letters, 30(15): 1820. doi:10.1029/2003GL017814.
7. (orange 200-1995): P.D. Jones and M.E. Mann (2004). , Reviews of Geophysics, 42: RG2002. doi:10.1029/2003RG000143
8. (red-orange 1500-1980): S. Huang (2004). , Geophys. Res Lett., 31: L13205. doi:10.1029/2004GL019781
9. (red 1-1979): A. Moberg, D.M. Sonechkin, K. Holmgren, N.M. Datsenko and W. Karlén (2005). , Nature, 443: 613-617. doi:10.1038/nature03265
10. (dark red 1600-1990): J.H. Oerlemans (2005). , Science, 308: 675-677. doi:10.1126/science.1107046
(black 1856-2004): Instrumental data was jointly compiled by the Climatic Research Unit and the UK Meteorological Office Hadley Centre. Global Annual Average data set TaveGL2v [2] was used.
Documentation for the most recent update of the CRU/Hadley instrumental data set appears in: P.D. Jones and A. Moberg (2003). , Journal of Climate, 16: 206-223.
|
|